I’m a member of the team that builds ScriptRunner for Jira Cloud at work. It’s essentially a SaaS product that does remote script executions. Our primary microservices are built on the Ratpack web server framework that is built on top of Netty.
The problem
We had a single customer report that part of our product was no longer loading in their browser. They kept seeing 504 HTTP responses from our load balancer. Around the same time we noticed a spike in failed deployments due to health checks timing out.
Although we could not reproduce the problem in production, we could at least observe it occuring on our logs with low frequency. We run our product infrastructure on AWS and the two potential reasons for a 504 response from our load balancer were: connection failure and request timeout. Our application logs showed that some “random” requests, including the ones reported by the customer, would suddenly spike high in duration, from sub-second response times to minutes.
Debugging
There was no correlation with spikes in web traffic, time of day, GC operations, and the request durations for the affected instances did not ramp up over time; they just spiked without warning. We relocated a CPU intensive workload out of the relevant microservice (long overdue). This showed us that there was no spike in CPU usage at the time of long duration requests. Then we increased the CPU capacity that the microservice instances run with in order to avoid any CPU contention between other body services running on the underlying ECS cluster.
For the deployments that were failing due to health check failures the situation seemed even stranger. Firstly (and we’re still digging into this), health checks from the load balancer are not the first requests that the service instances receive. Secondly, the first set of health check requests (one from each Availablity Zone that the load balancer runs in) received responses in tens of milliseconds, and then we’d see 60s health check durations in our application logs for seemingly no reason, followed by a return to millisecond response times afterwards.
We added additional sampling logging to try and establish where the delays were occurring in our request handling chain, and could see that Promises of work (like a network request to another service) were taking tens of seconds to yield a value because of a delay between the Promise evaluation starting and it receiving a value. The other service we made requests to reported single digit millisecond response times which didn’t match the amount of time that our handlers were taking.
What is Ratpack doing?
Ratpack works by spinning up a number of compute threads which handle inbound requests and perform CPU-only work. Additionally, there is an autoscaling pool of additional “blocking” threads which must be used by applications for any IO operations like network requests or disk access.
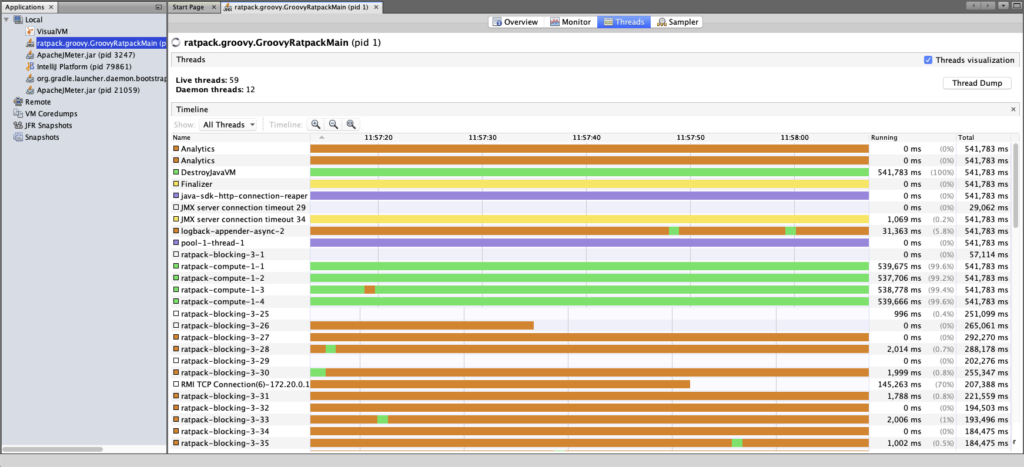
A single request may be processed by multiple compute threads, depending on how the CPU work in the handlers are scheduled. This meant we were unable to filter our application logs by the thread name in order to look for problems.
In our case we use two instances of the built-in Ratpack HTTP client for inter-service requests and monitoring the thread pool for those clients showed nominal performance. This eliminated those HTTP client pools from being the bottleneck.
We also use the AWS SDK extensively, and wrap each API call in a Blocking.get() because under the hood the SDK uses HTTP for communication with AWS services.
Finding the problem
After consulting with a few different colleagues we determined that we must be doing some blocking work (eg network request) on a compute thread. This is the cardinal sin of Ratpack abuse as it prevents that compute thread from doing any work while it waits around for the blocking operation to complete. Any CPU related work or request handling work that is scheduled onto that thread is blocked. This explained why request handlers that made external network calls could seemingly sit around doing nothing, and how health checks that should take milliseconds were taking minutes. The thread was busy waiting.
The problem was finding what exactly we were doing wrong because any request to the service could be hogging the compute thread. We contemplated writing an ExecInterceptor to log details of compute “blocks” that took too long. Thankfully our head of engineering relayed some experience with another product, built on Ratpack, that did significant relational database work. That team had experienced similar problems and looked at the requests that preceded slow ones in order to find areas of the codebase to investigate.
In our case I was able to filter out requests that preceded the slow ones until I spotted some other requests that we expected would be slow, but that I knew were using the AWS SDK. Following through the code paths for those requests revealed that we were fetching records from DynamoDB. Dutifully we wrapped the .query() API calls in Blocking.get() so all was good there. However, we were iterating over the results in a .map() block on the Promise returned by Blocking.get(). A little digging revealed that an ItemCollection (from DynamoDB) could perform network requests when .next() is called. Bingo: we were doing network requests on a compute thread 😬
The fix
Thankfully fixing the problem was easy: I moved the result iteration into the Blocking.get() operation, which was easier than rewriting the iteration logic to use Blocking.get() whenever it called .next().
Since releasing the code change we’ve seen zero unexpected 504s from our load balancer to this service, and the customer was happy once again. Success!